Hypothesis Testing Made: Score satisfied
Machine Learning techniques used:
1- Neural Networks
2- Decision Trees
Scores are satisfactory.
Bitcoin Price is dependent on the other small cryptocurrency’s prices, volumes, and trends.
Hypothesis Testing Made: Score satisfied
Machine Learning techniques used:
1- Neural Networks
2- Decision Trees
Scores are satisfactory.
Bitcoin Price is dependent on the other small cryptocurrency’s prices, volumes, and trends.
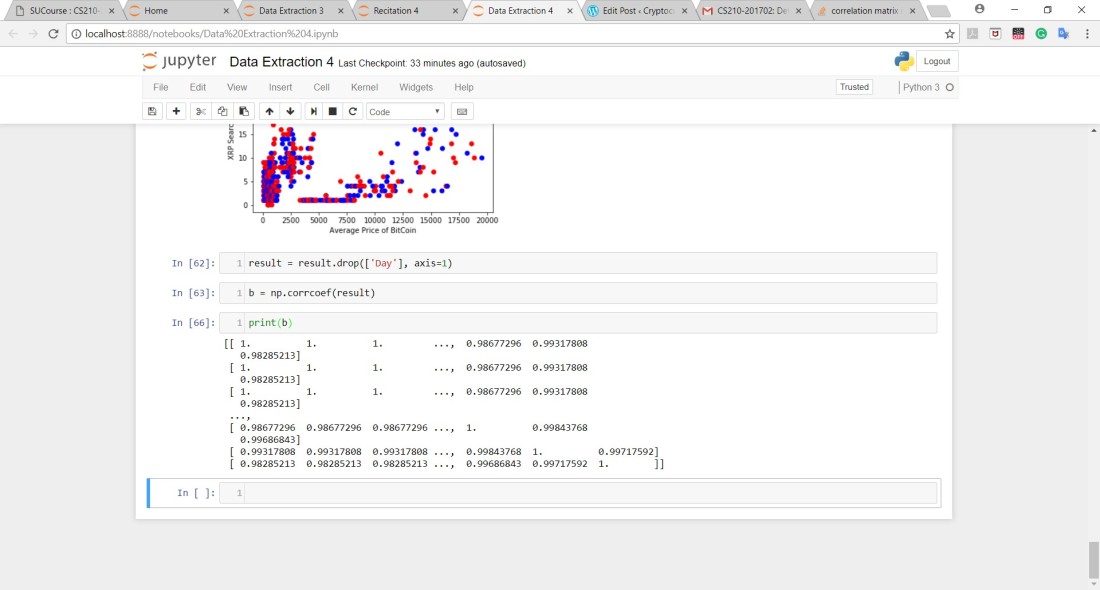
Here is a screenshot of the Correlation Matrix:
In this article, I’ll publish the Scatter Graphs between all of the features and my target (BitCoin Price)
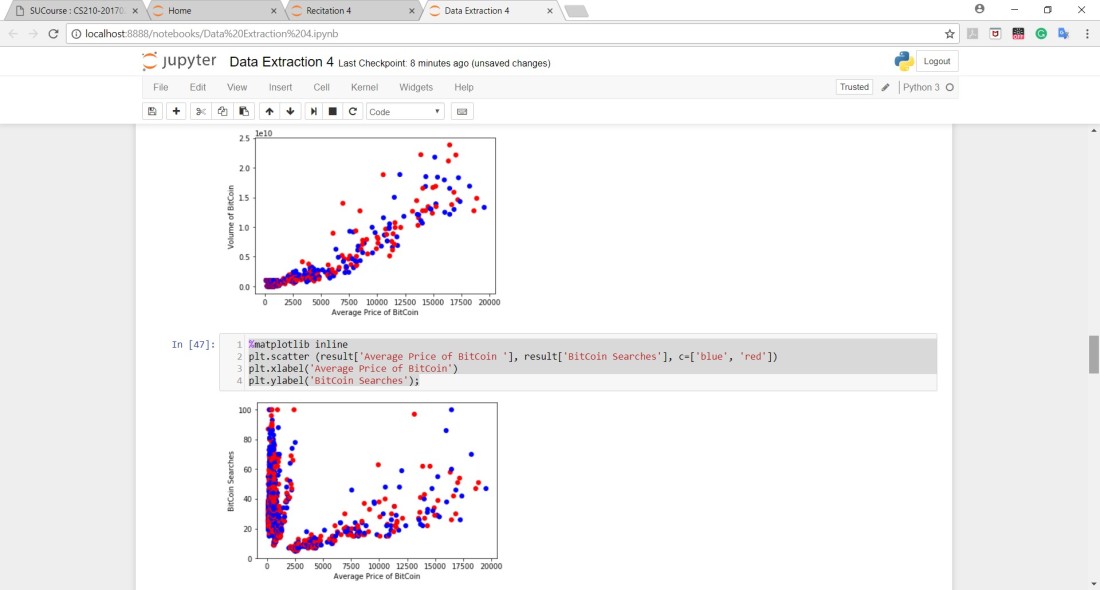
The first two graphs show the correlation between the volume of Bitcoin and the Trend of the word BitCoin on google with my target. As you can see, there is a positive correlation with the volume but no correlation with Trend of the word BitCoin:
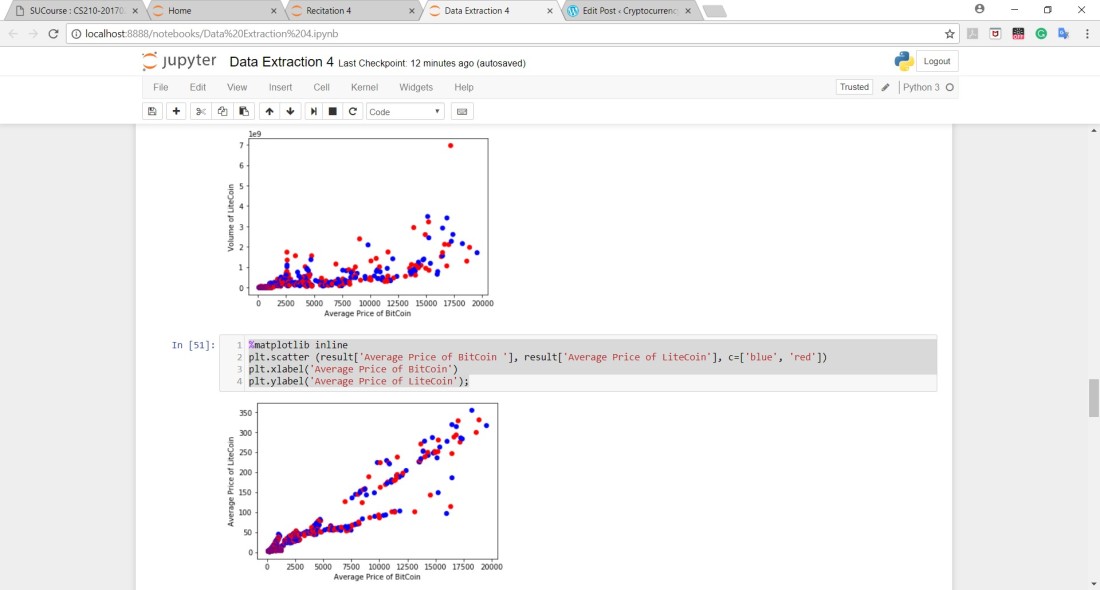
The second two graphs show the correlation between the volume of LiteCoin and the average price of LiteCoin with my target. As you can see, there is a weak positive correlation with the volume but there is a strong positive correlation with the Average Price of LiteCoin:
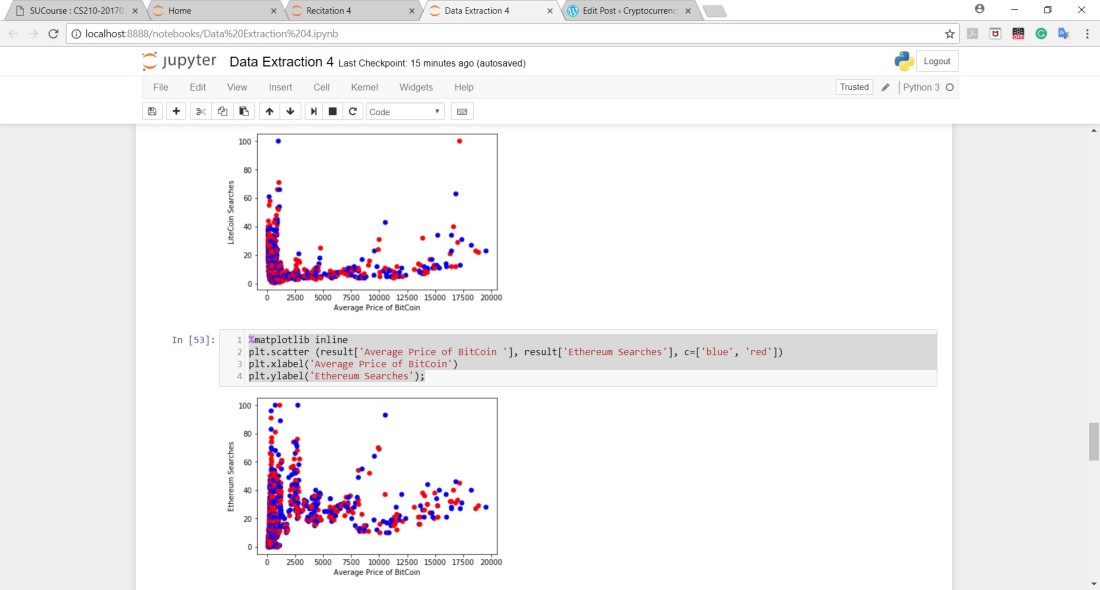
The next two graphs show the correlation between the LiteCoin Trend on google and the Ethereum Trend on google. As you can see, there is no correlation in both graphs. They both show weird behavior:
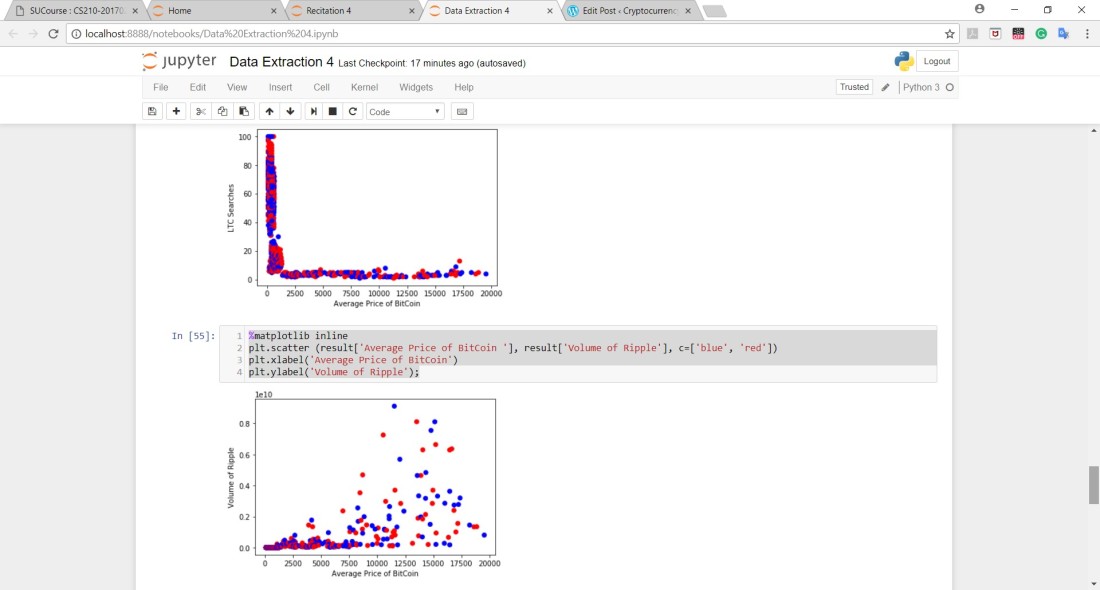
The next two graphs show the correlation between the LTC Trend on google and the volume of Ripple. As you can see, there is no correlation in both graphs. Again, they both show weird behavior:
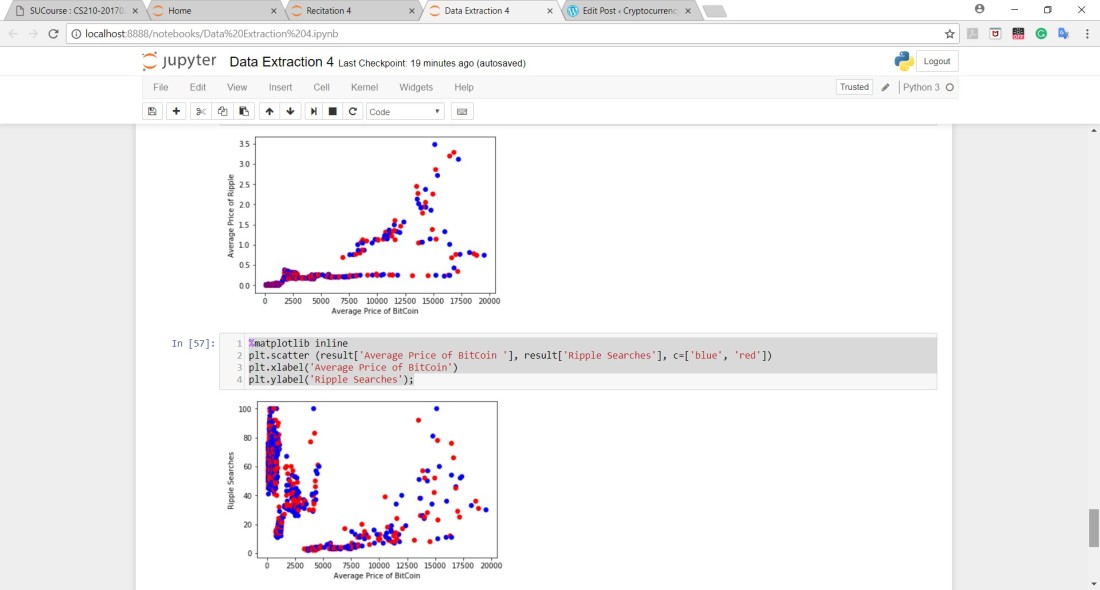
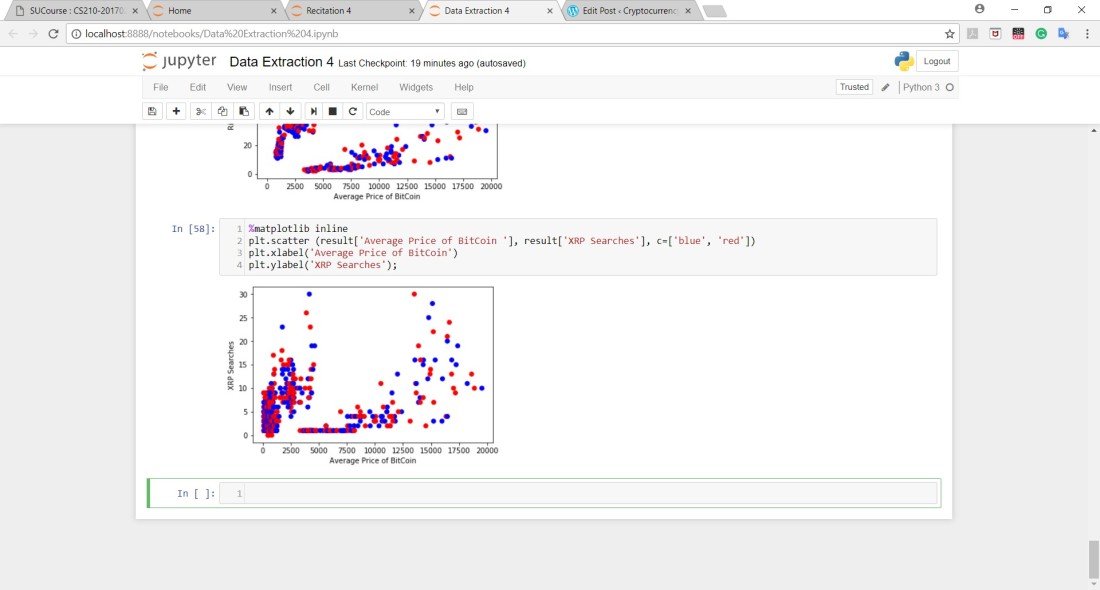
The last three graphs show the correlation between the Average Price of Ripple and the Trends of both Ripple and XRP on google. As you can see, there is no correlation in the last two graphs but the first graph shows a weak positive correlation with a weird behavior:
I chose Neural Networks as my second Machine Learning technique since it works well with integer or float values as an input. In addition, since I had huge numbers as inputs, it was better for me to normalize these numbers in which I did.
I followed the same cleaning procedures to my data with the same Target and Features as the previous articles and ran the Neural Networks algorithm and this was the result:
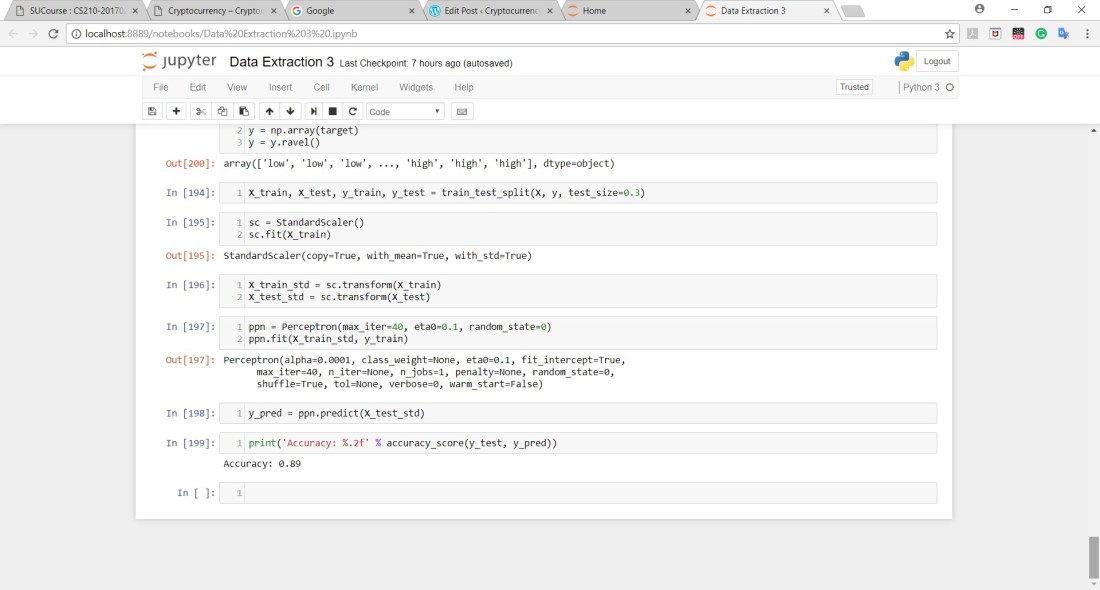
Again, Impressive Result. (using all of the data)
Decision Trees worked better because my data set the perfect scene for a decision tree. Decision trees work the best with numbers and categorical data hence why it outperformed the Neural Networks.
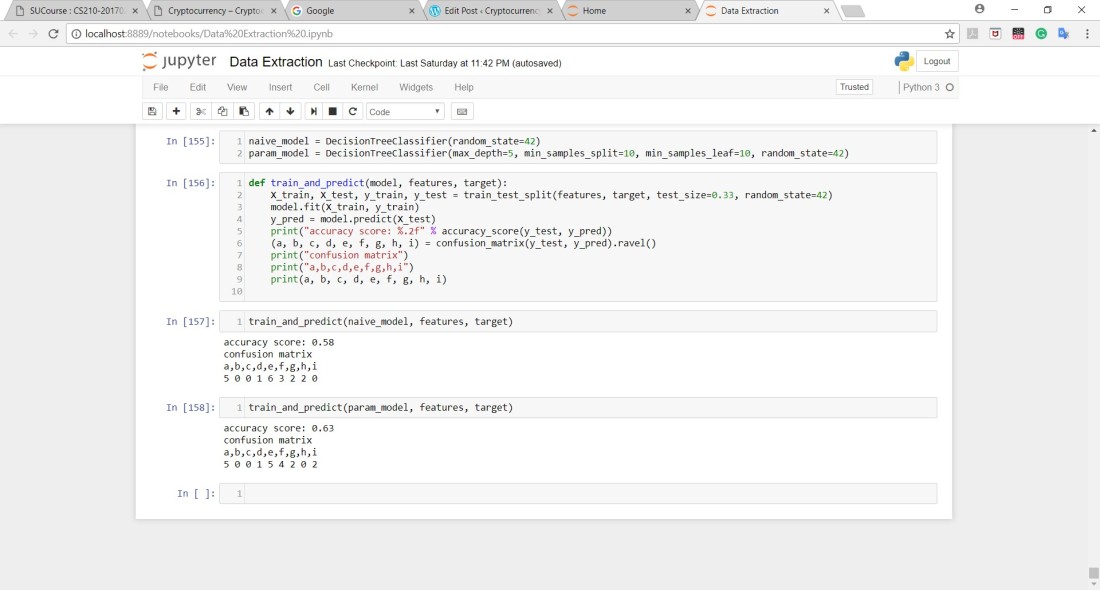
Since combining the data of each month produced awful results, I decided not to do that but this lead to another problem. As I said in the previous article, Google Trend only offers data in months when choosing a large time range so this meant that I had to get the data in small sections and then combine them all together to obtain the values of Google Trend daily. Google Trend only provides daily data when the time range doesn’t exceed 6 to 8 months. After combining all of the data together, I obtained the datasets of Google Trend that contained daily data from 2013 up until 2018. I also did the same cleaning procedures to the previous data with some extra things and then I ran the Decision Tree Algorithm and these were the results:
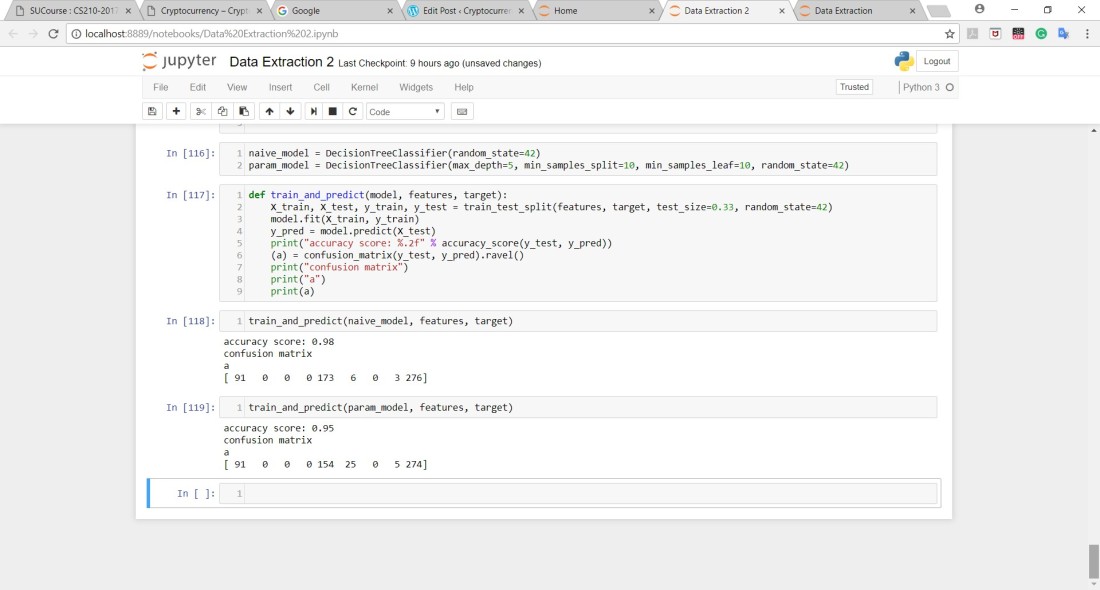
A huge improvement in the accuracy scores but param model’s accuracy score is actually lower than the naive model which is okay. The param model doesn’t always guarantee an improvement in results.
My project involves a lot of numbers and a lot of Dirty data so in order for me to run a Machine Learning algorithm on my Data, I had to clean my data carefully and this took a lot of time. Cleaning the data or obtaining clean tables with good data was the most difficult thing about this project.
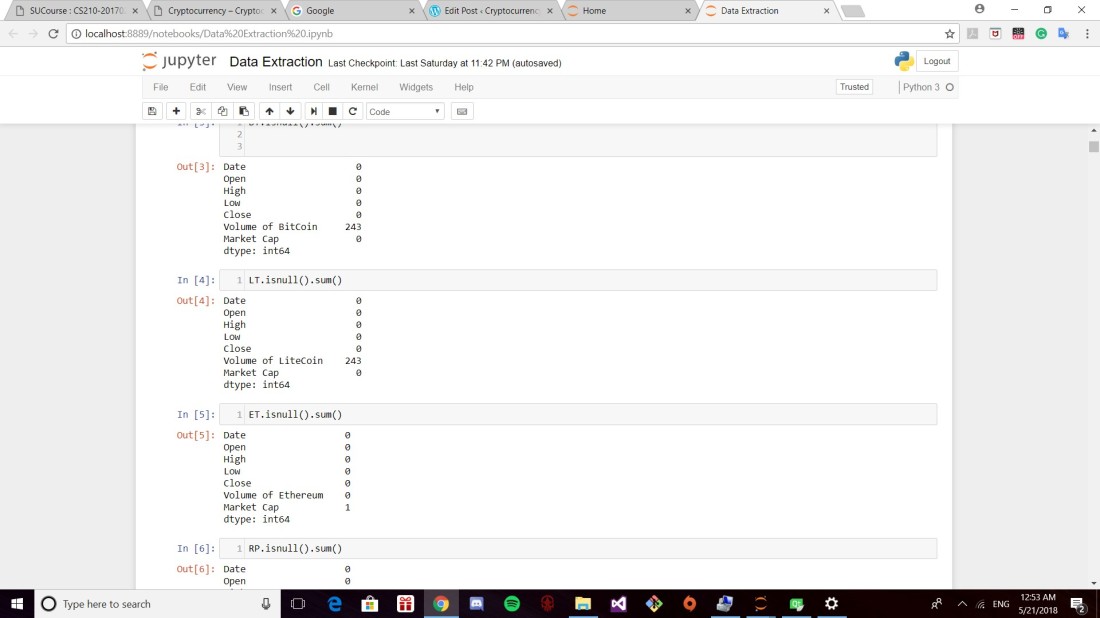
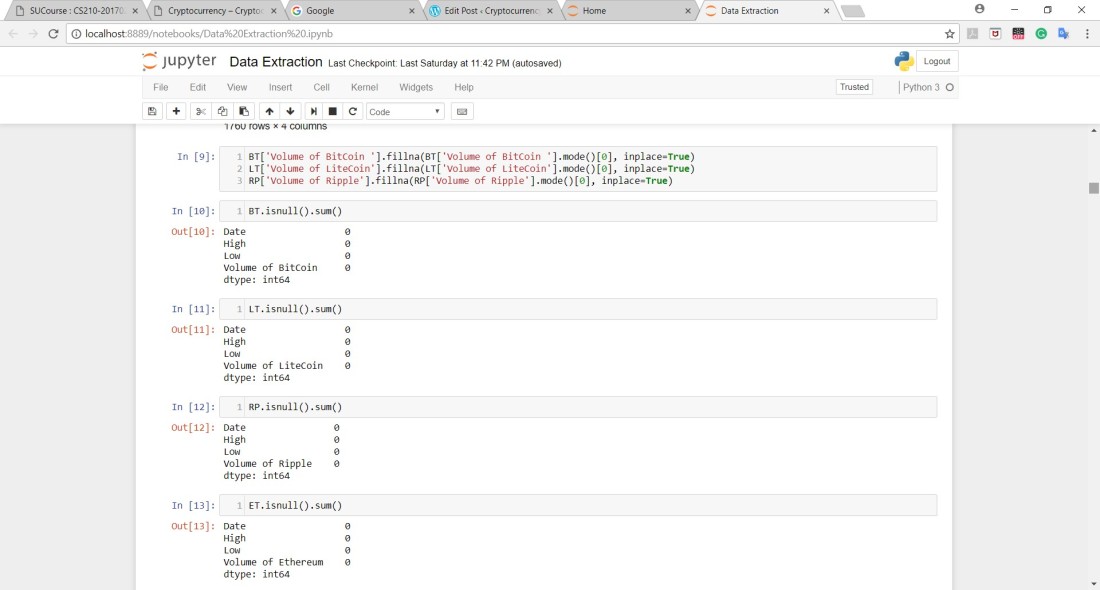
In the beginning, I had to check if my data had any null values in which I did. In order to obtain good results, I had to fill in these null values of Volume in the three files that contained the prices of Bitcoin, Ripple, and Litecoin.
After that, The files had the High and Low prices of each CryptoCurrency in which I had to calculate the average of these two columns and replace these two columns by just one that contained the average price only.
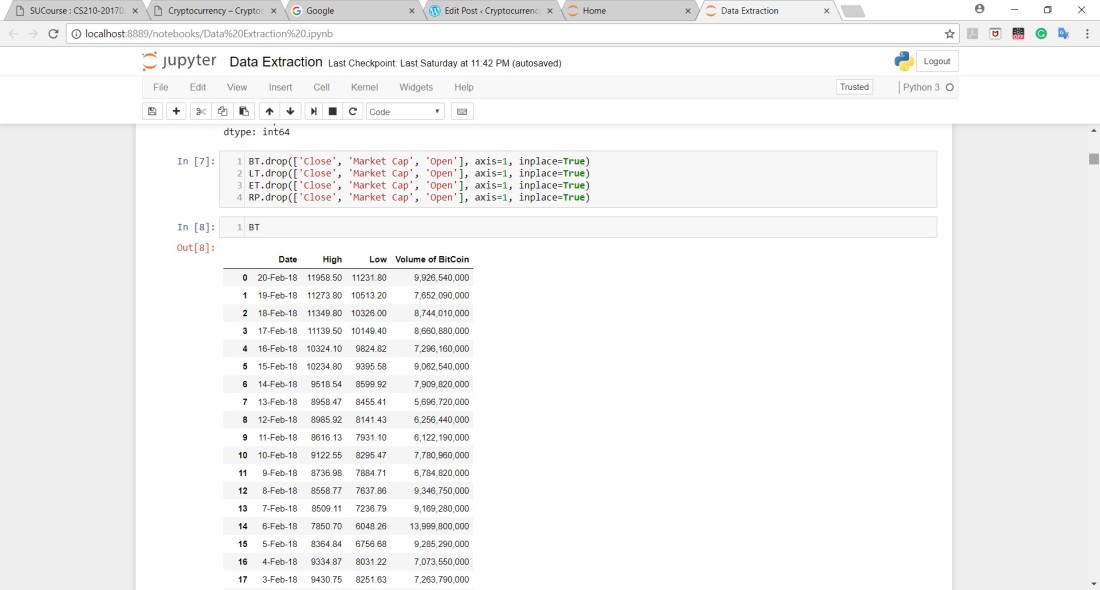
After doing this step, this is what the data looks like after dropping irrelevant columns as well:
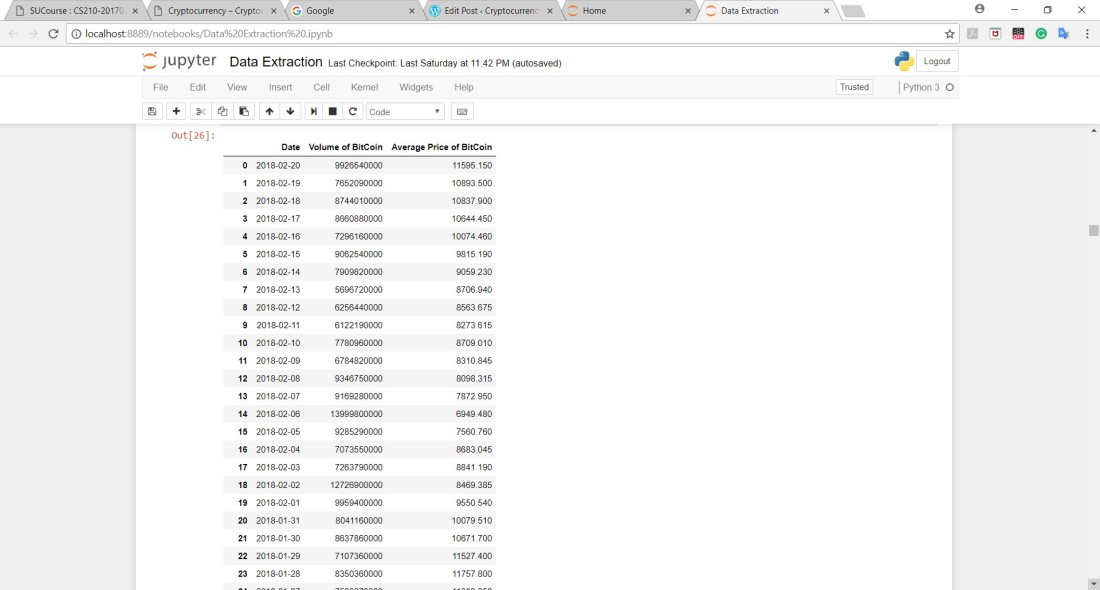
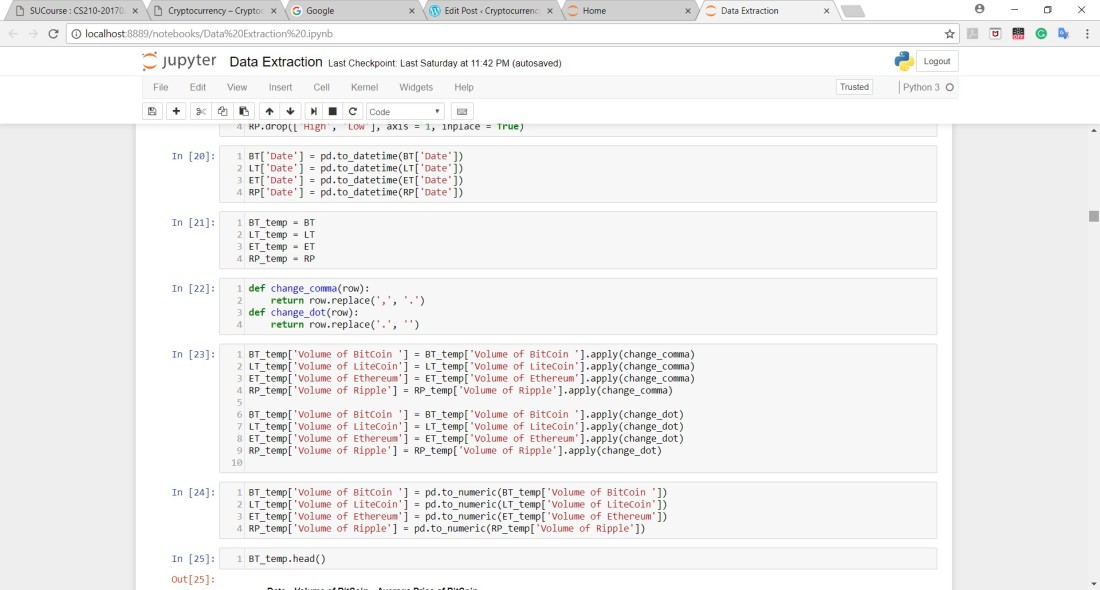
In addition, Values of the volume in each CSV file had commas between them which weren’t appropriate for integer values in python so they were replaced by dots instead that are understandable by python:
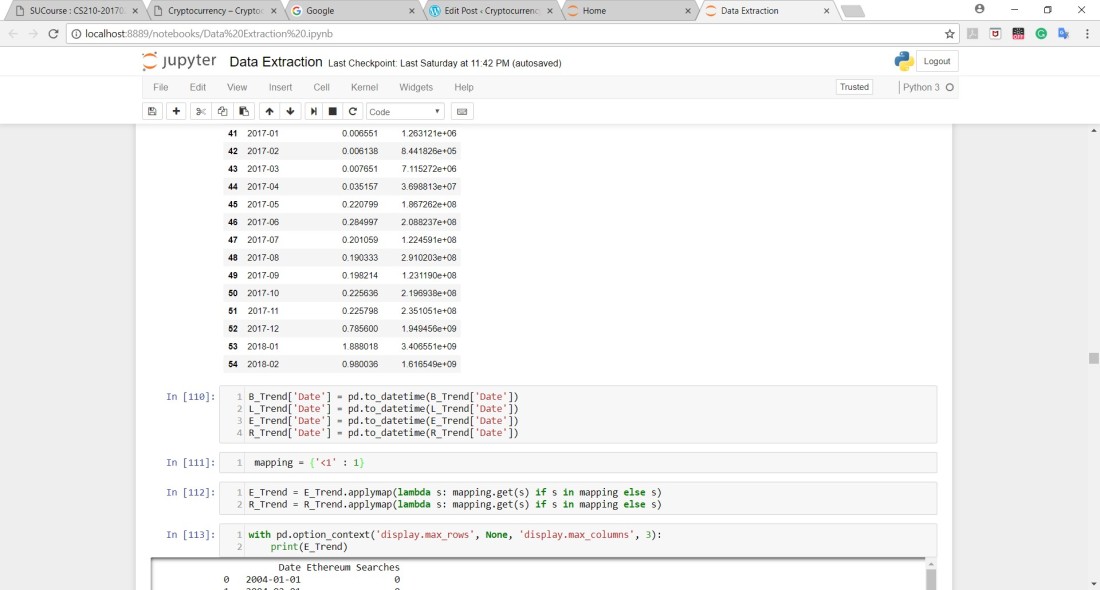
After obtaining such tables for each file, I figured that the dates were a lot in which I was wrong afterward. I decided to combine the values of each month of every year into one row by calculating the mean of every month which reduced a lot of rows and in addition to that, I had data from Google trend that was from 2004 and they were only offered in months when one takes a large time range so I had to keep the dates constant in all of the data (starting and ending dates as well). I also had to convert the dates to data variables :
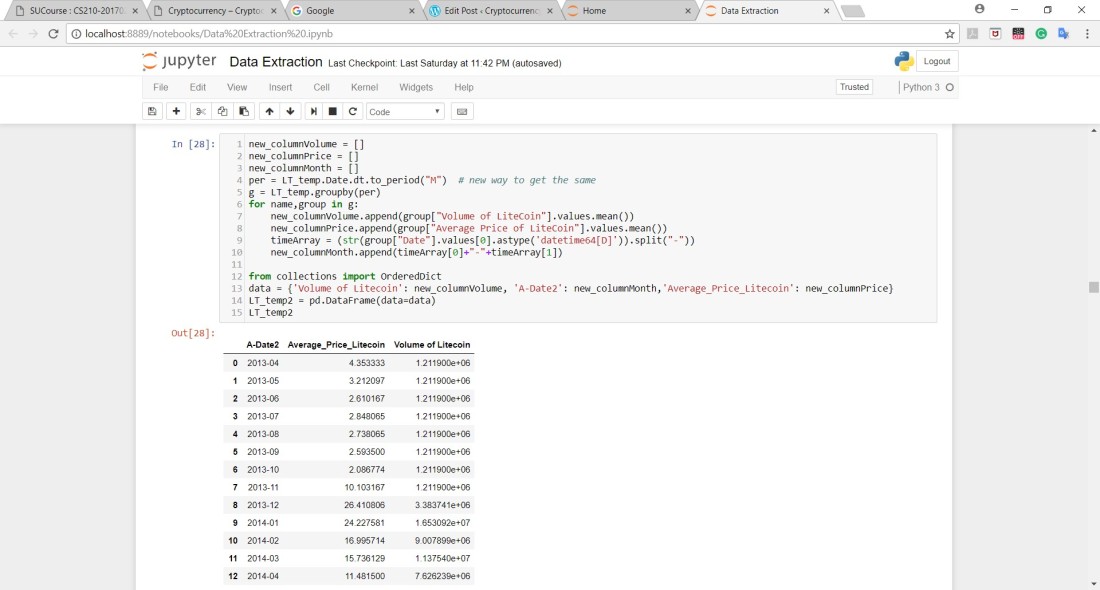
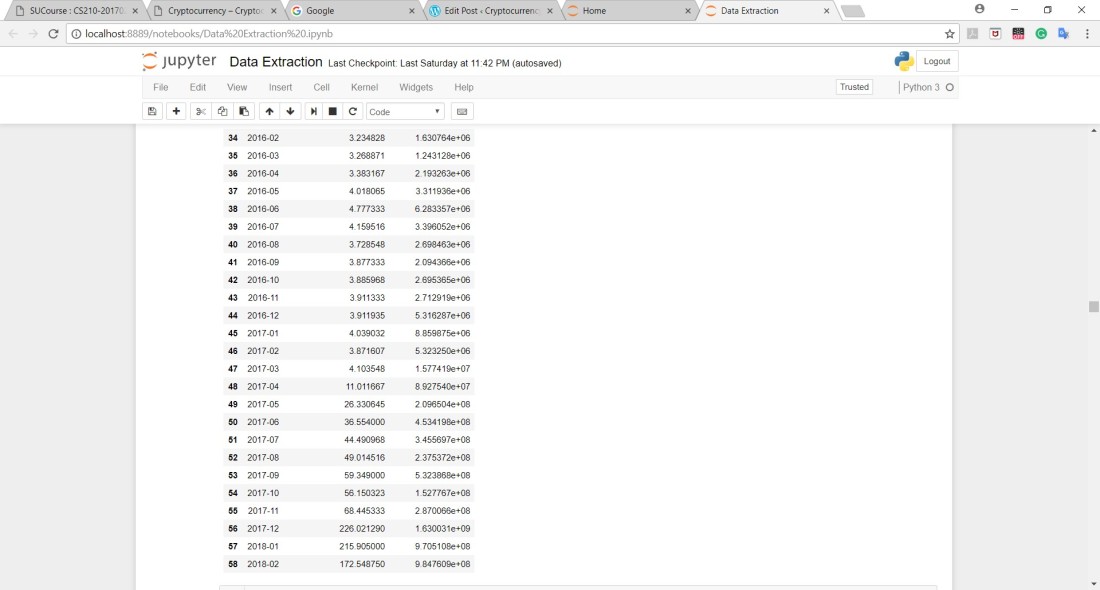
It reduced the rows from 1600+ rows to 55 rows only and this was done to every CSV file:
Google Trend Data also needed some cleaning. The data has numbers between 0 and 100 in which these numbers determine the popularity of the searched item during that time. Some of the values were written as “<1” so I replaced them with 1 since the difference between 0 and 1 is negligible in terms of popularity.
Some of the datasets had dates that were inconsistent compared to other datasets that I had so I had to drop some of these dates from different datasets:
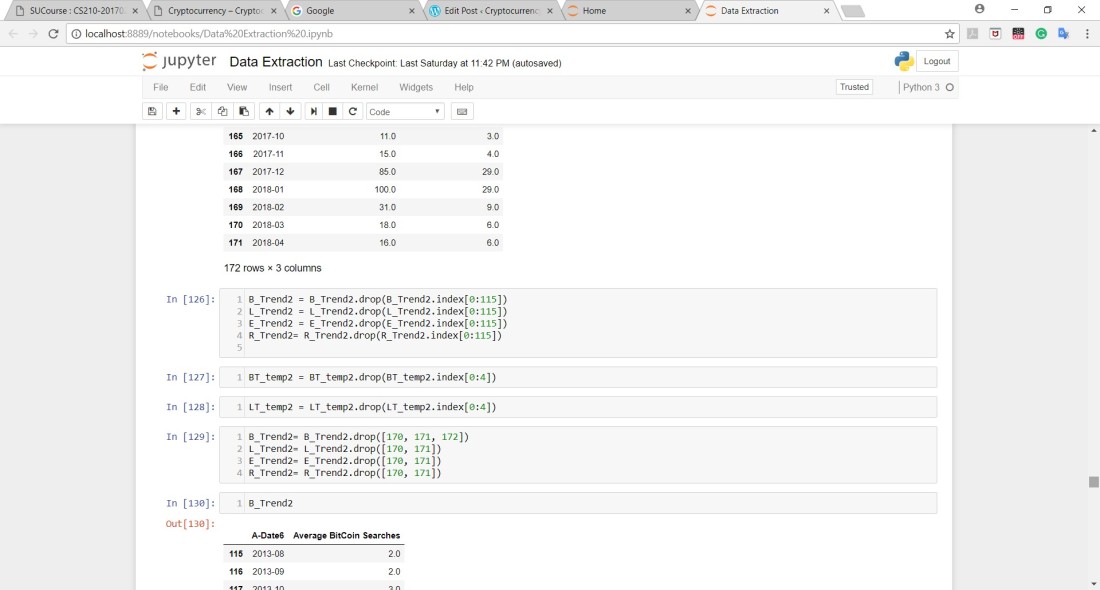
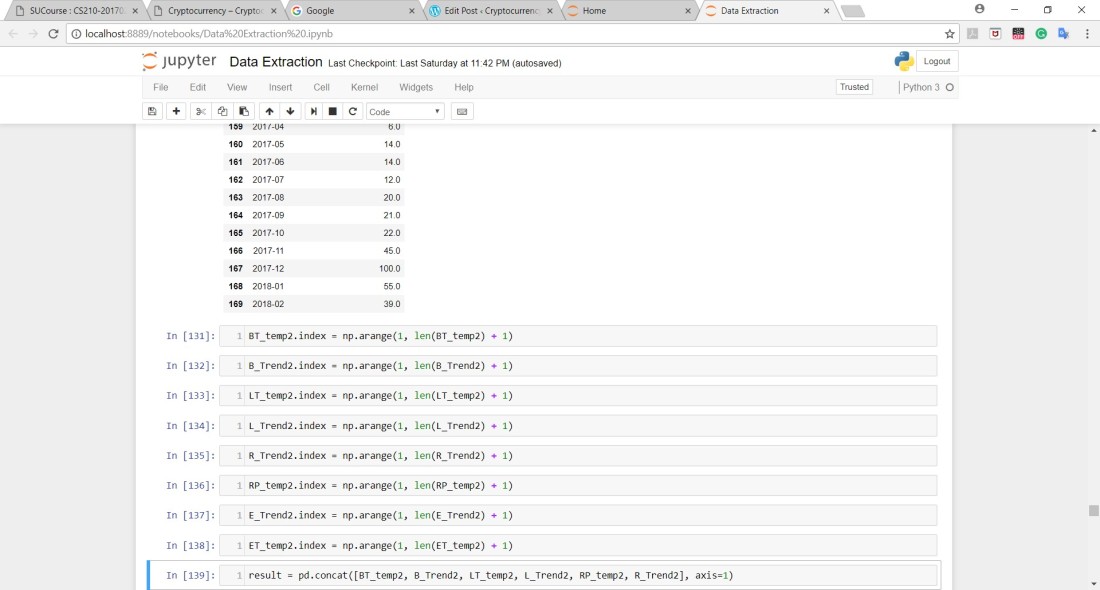
After dropping some of the dates, the indices of the data sets changed so I had to linearize them for all of the data frames that were included in this project. Since all of them were now linearized, I merged all of the data into one data frame:
Here is a description of the data that’s in the one data frame called Result:
Since I wanted to see the things that affect the price of Bitcoin, I decided to use Decision Trees as my first Machine Learning Technique. In addition to that, I was dealing with a lot of numbers and the Price of Bitcoin could be easily categorized into ‘low’, ‘medium’ and ‘high’. In order for me to determine the range of these categories, I calculated the mean and the median and I had to look at the maximum and minimum values of Bitcoin and then I decided the ranges accordingly.
From 0 to 550 = ‘low’ from 550 to 900 ‘medium’ and from 900 to 15200 as ‘high’ since I only had 55 rows of data:
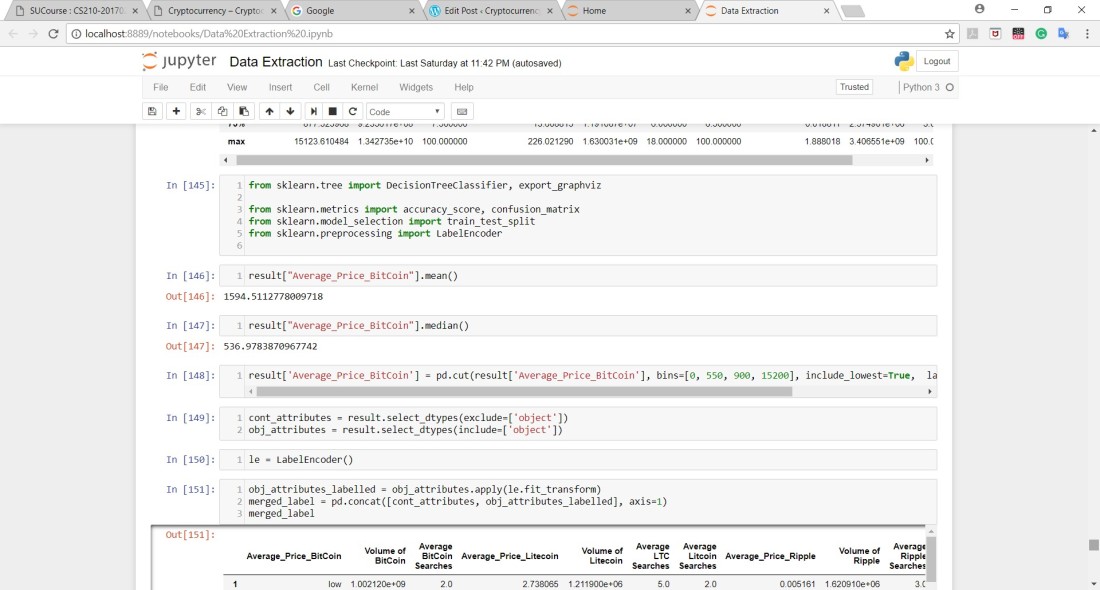
After all of this, I had the Average price of Bitcoin as my target and the rest of the columns as my features which were only 12 (unfortunately) and I ran the Decision Tree Algorithm on the data I’ve obtained after cleaning and these were the results:
 Awful Results I must say but this encouraged me to run the Decision Tree Algorithm without combining the data into Months which meant that I had 1600+ rows which really improved the results.
I used the Bitcoin.csv which had the volume and prices of Bitcoin.
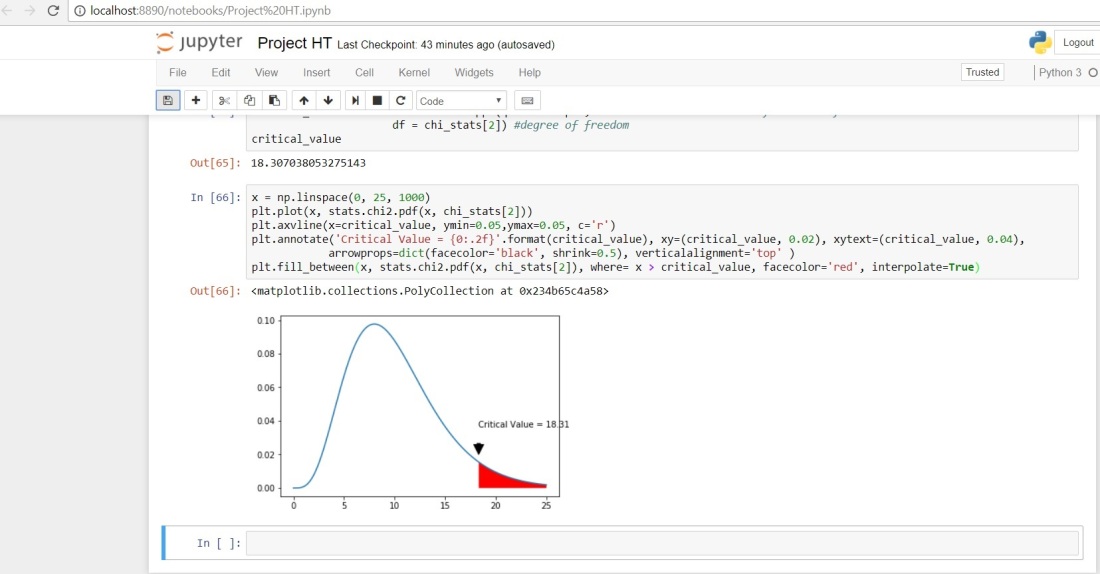
One of the questions that I had in my proposal was if the volume of Bitcoin had any effect on its price. This graph shows the critical value calculated for the relation between Bitcoin and its Volume which was one indication of my Hypothesis. The hypothesis was to be able to predict Currency’s price by finding a relationship with a factor. Null Hypothesis would be that there is no relation. Since the critical value is greater than 5, we can reject the Null Hypothesis and the Hypothesis holds.

Cryptocurrency is a digital currency in which encryption techniques are used to regulate the generation of units of currency and verify the transfer of funds.
The number of cryptocurrencies available over the internet as of 7 January 2018 is over 1384 and growing.
Here are some of the most viral ones:
Cryptocurrency is a hot topic these days and lots of people have been wondering about the path of price fluctuations that these currencies are going through. In this project, I will be focusing on the prices of Bitcoin, Litecoin, Ripple, and Ethereum to try and understand the behavior of their prices.
Cryptocurrency is a digital currency in which encryption techniques are used to regulate the generation of units of currency and verify the transfer of funds, operating independently of a central bank which means that its price does not depend on the local market or the local economy.
The number of cryptocurrencies available over the internet as of 7 January 2018 is over 1384 and growing.
Here are some of the most viral ones:
Cryptocurrency is a hot topic these days and lots of people have been wondering about the path of price fluctuations that these currencies are going through. In this project, I will be focusing on Bitcoin because it is the one that went viral the most, and it also had an impact on the prices of other cryptocurrencies. It’s interesting to find a correlation with the price of Bitcoin in order to predict its price in the future for trading purposes.
The two free data sets that have been obtained are as follow:
I think and have actually observed that there is a high correlation between these two data sets. To have a clearer view of how there might be a correlation between both sets, here’s a graph showing the search count for the word “Bitcoin” in millions:
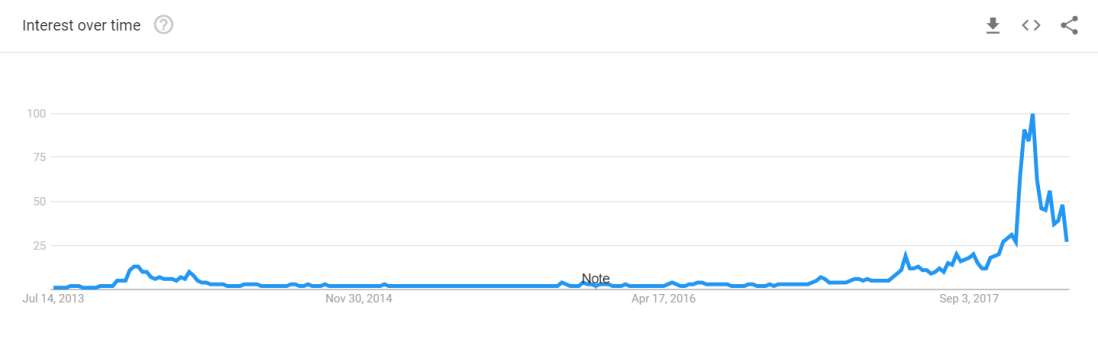
With the data from the first dataset, it confirms that at those high spikes in 2017, this is when Bitcoin’s price Skyrocketed.
Links to obtained datasets:
