My project involves a lot of numbers and a lot of Dirty data so in order for me to run a Machine Learning algorithm on my Data, I had to clean my data carefully and this took a lot of time. Cleaning the data or obtaining clean tables with good data was the most difficult thing about this project.
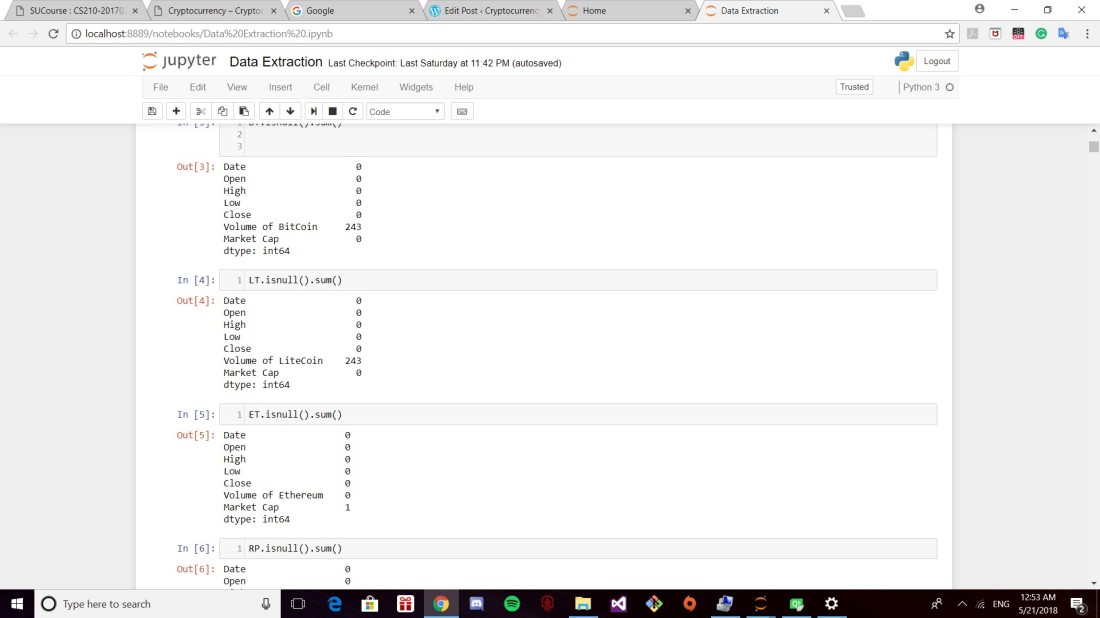
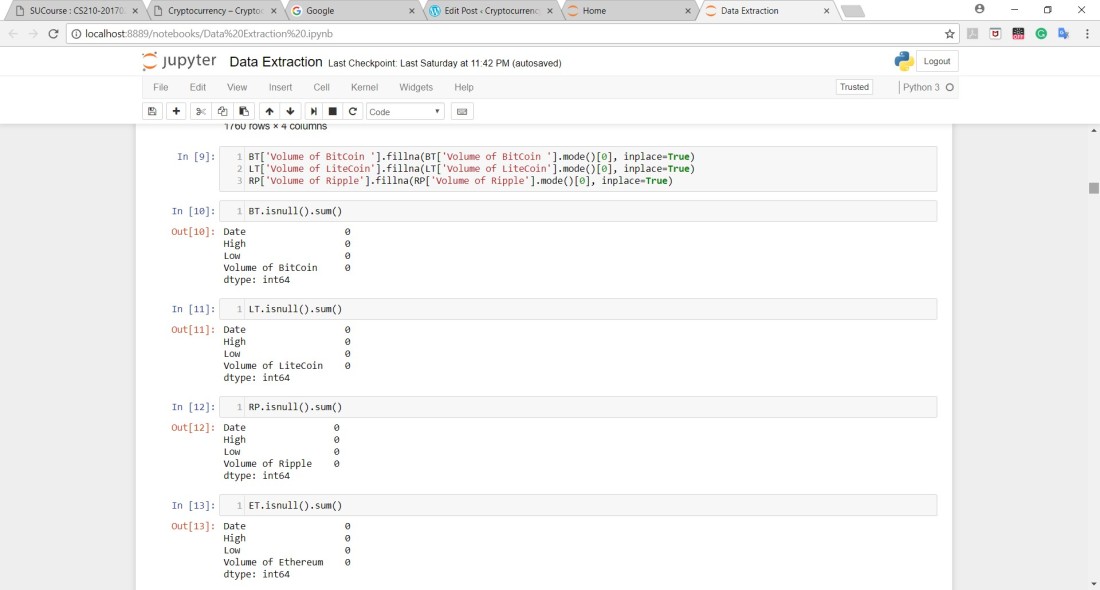
In the beginning, I had to check if my data had any null values in which I did. In order to obtain good results, I had to fill in these null values of Volume in the three files that contained the prices of Bitcoin, Ripple, and Litecoin.
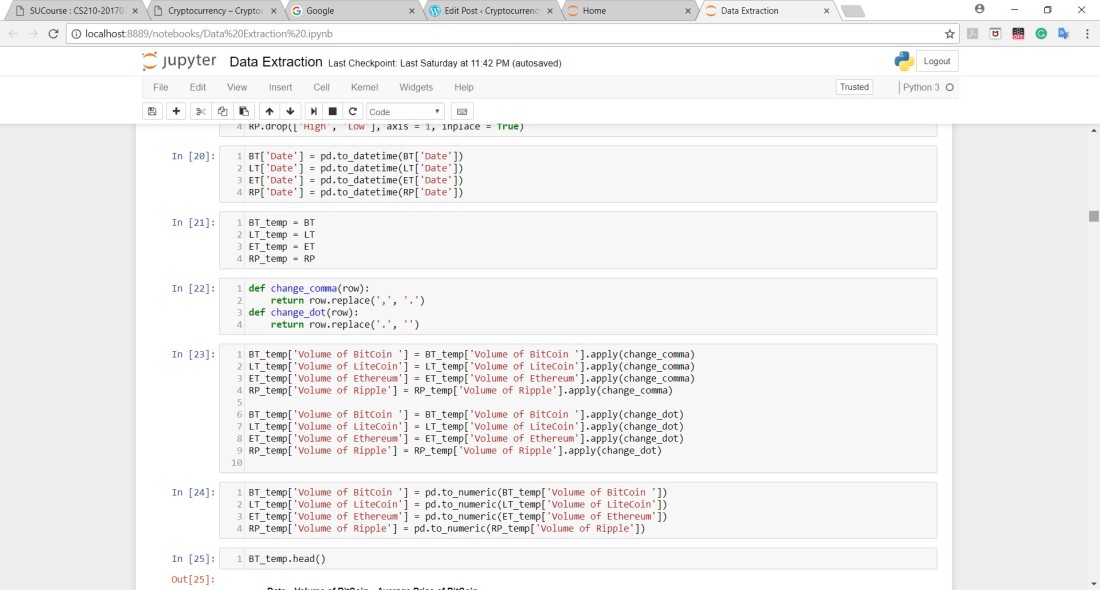
After that, The files had the High and Low prices of each CryptoCurrency in which I had to calculate the average of these two columns and replace these two columns by just one that contained the average price only.
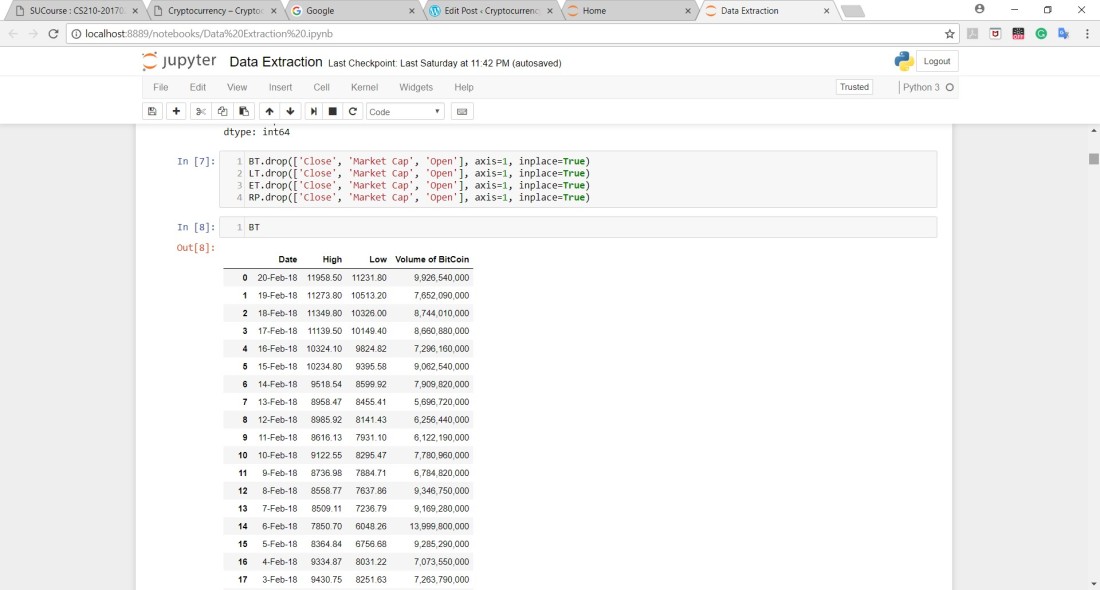
After doing this step, this is what the data looks like after dropping irrelevant columns as well:
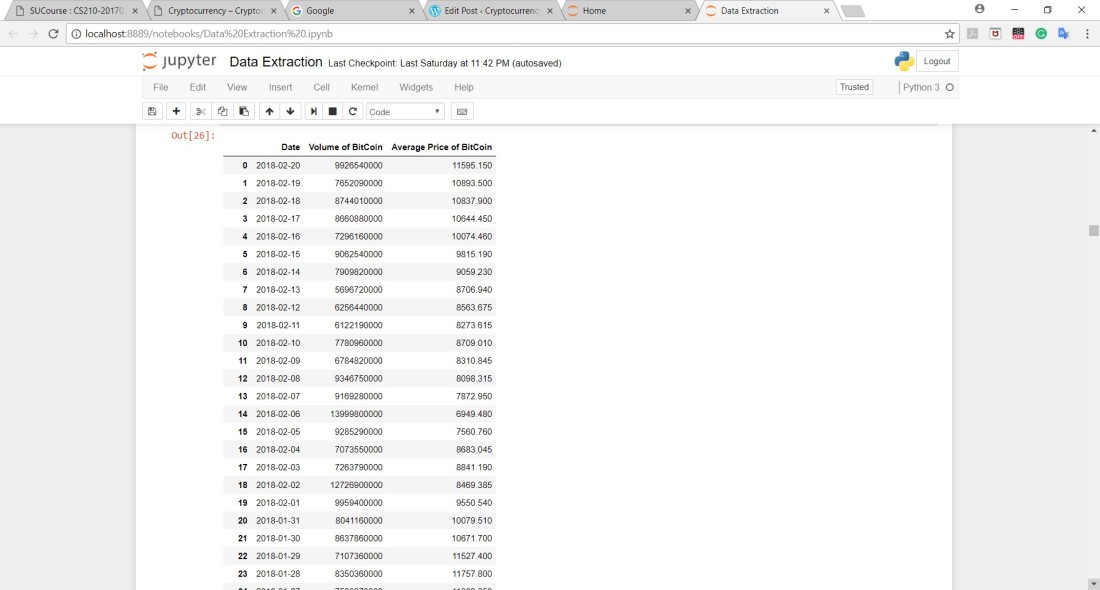
In addition, Values of the volume in each CSV file had commas between them which weren’t appropriate for integer values in python so they were replaced by dots instead that are understandable by python:
After obtaining such tables for each file, I figured that the dates were a lot in which I was wrong afterward. I decided to combine the values of each month of every year into one row by calculating the mean of every month which reduced a lot of rows and in addition to that, I had data from Google trend that was from 2004 and they were only offered in months when one takes a large time range so I had to keep the dates constant in all of the data (starting and ending dates as well). I also had to convert the dates to data variables :
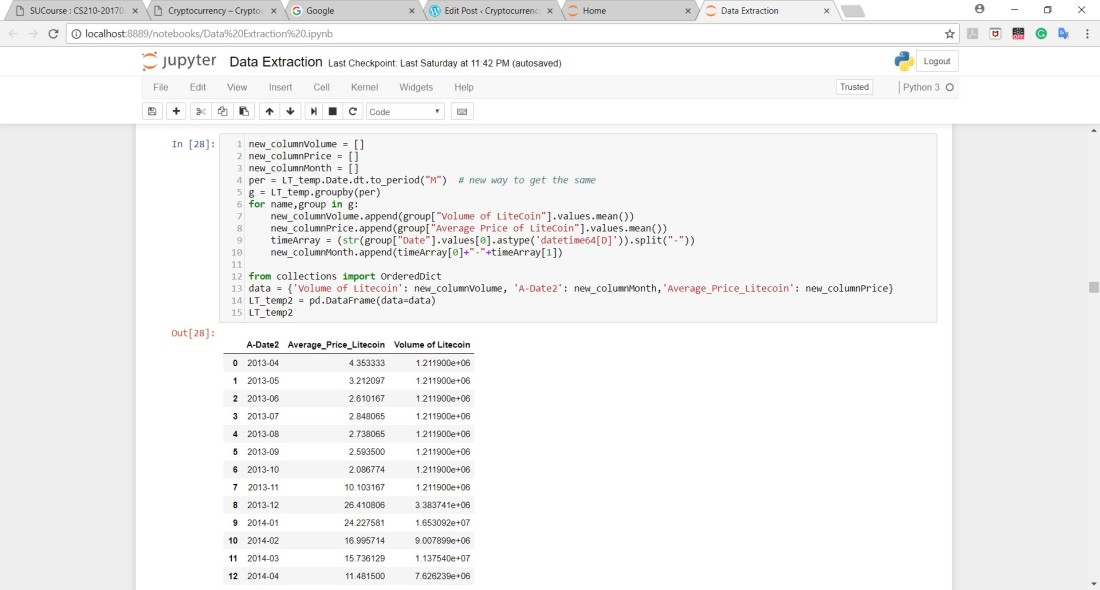
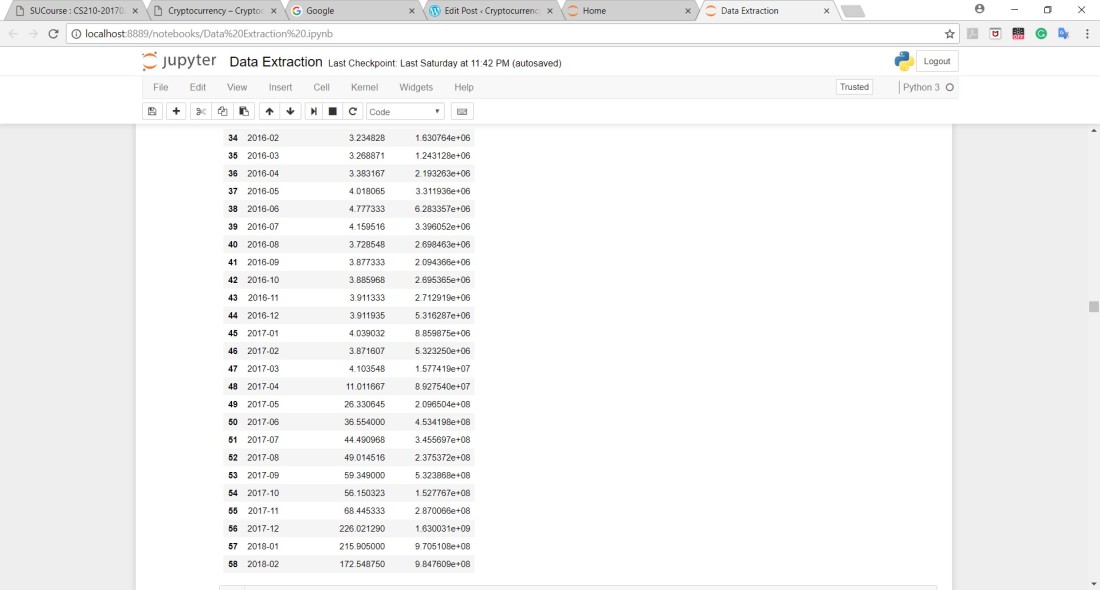
It reduced the rows from 1600+ rows to 55 rows only and this was done to every CSV file:
Google Trend Data also needed some cleaning. The data has numbers between 0 and 100 in which these numbers determine the popularity of the searched item during that time. Some of the values were written as “<1” so I replaced them with 1 since the difference between 0 and 1 is negligible in terms of popularity.
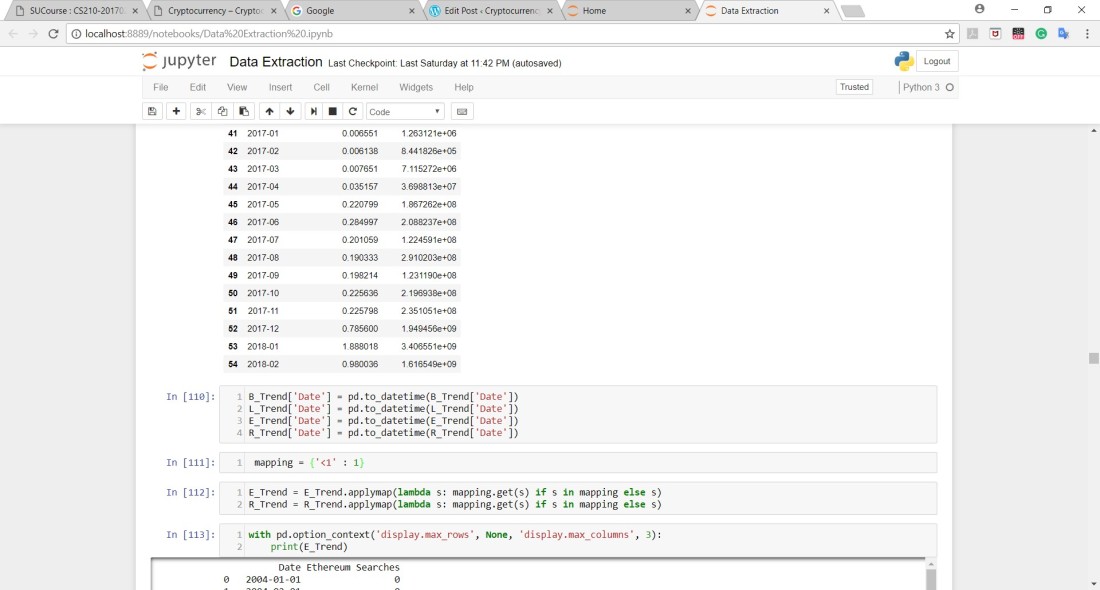
Some of the datasets had dates that were inconsistent compared to other datasets that I had so I had to drop some of these dates from different datasets:
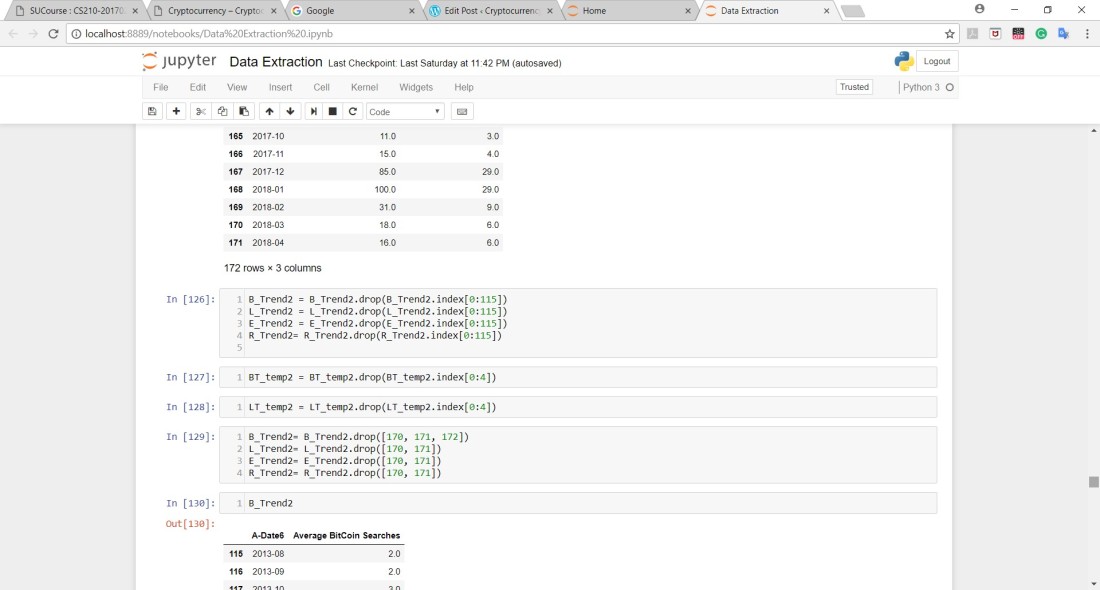
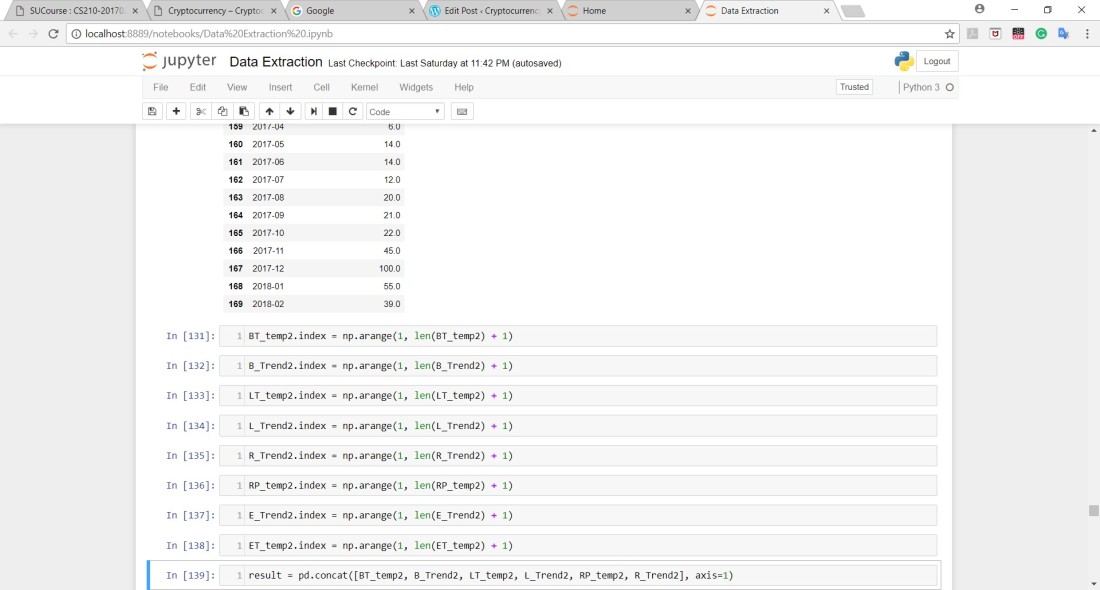
After dropping some of the dates, the indices of the data sets changed so I had to linearize them for all of the data frames that were included in this project. Since all of them were now linearized, I merged all of the data into one data frame:
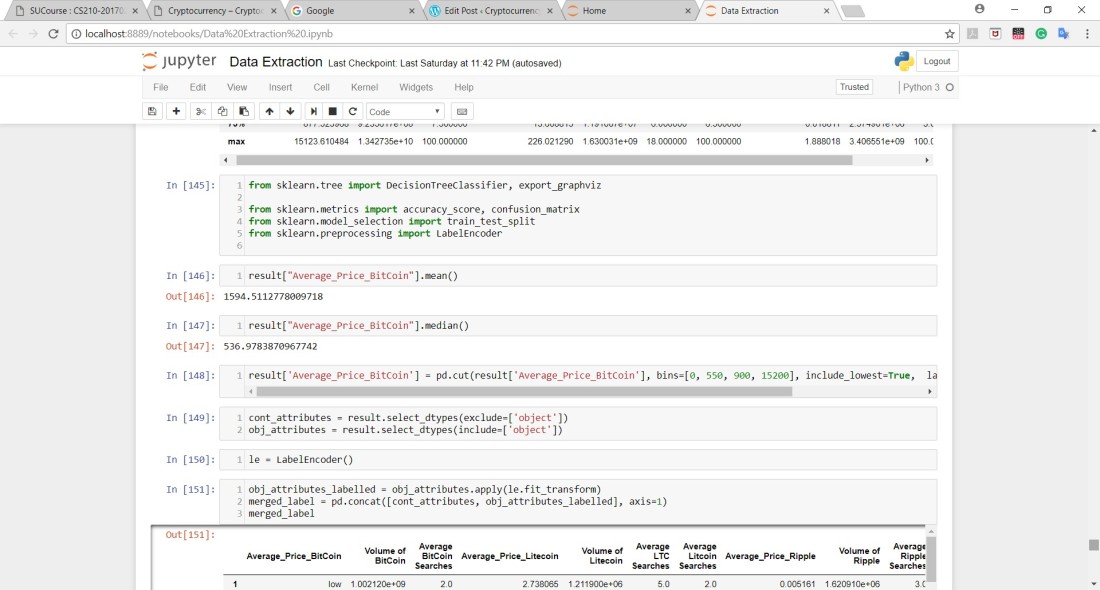
Here is a description of the data that’s in the one data frame called Result:
Since I wanted to see the things that affect the price of Bitcoin, I decided to use Decision Trees as my first Machine Learning Technique. In addition to that, I was dealing with a lot of numbers and the Price of Bitcoin could be easily categorized into ‘low’, ‘medium’ and ‘high’. In order for me to determine the range of these categories, I calculated the mean and the median and I had to look at the maximum and minimum values of Bitcoin and then I decided the ranges accordingly.
From 0 to 550 = ‘low’ from 550 to 900 ‘medium’ and from 900 to 15200 as ‘high’ since I only had 55 rows of data:
After all of this, I had the Average price of Bitcoin as my target and the rest of the columns as my features which were only 12 (unfortunately) and I ran the Decision Tree Algorithm on the data I’ve obtained after cleaning and these were the results:
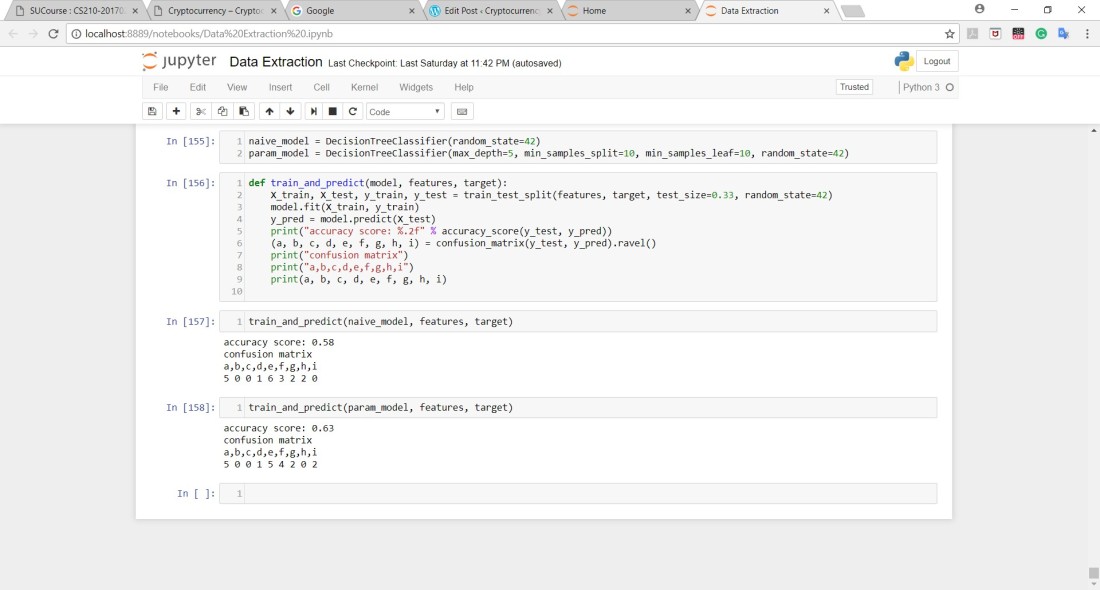 Awful Results I must say but this encouraged me to run the Decision Tree Algorithm without combining the data into Months which meant that I had 1600+ rows which really improved the results.
