In this article, I’ll publish the Scatter Graphs between all of the features and my target (BitCoin Price)
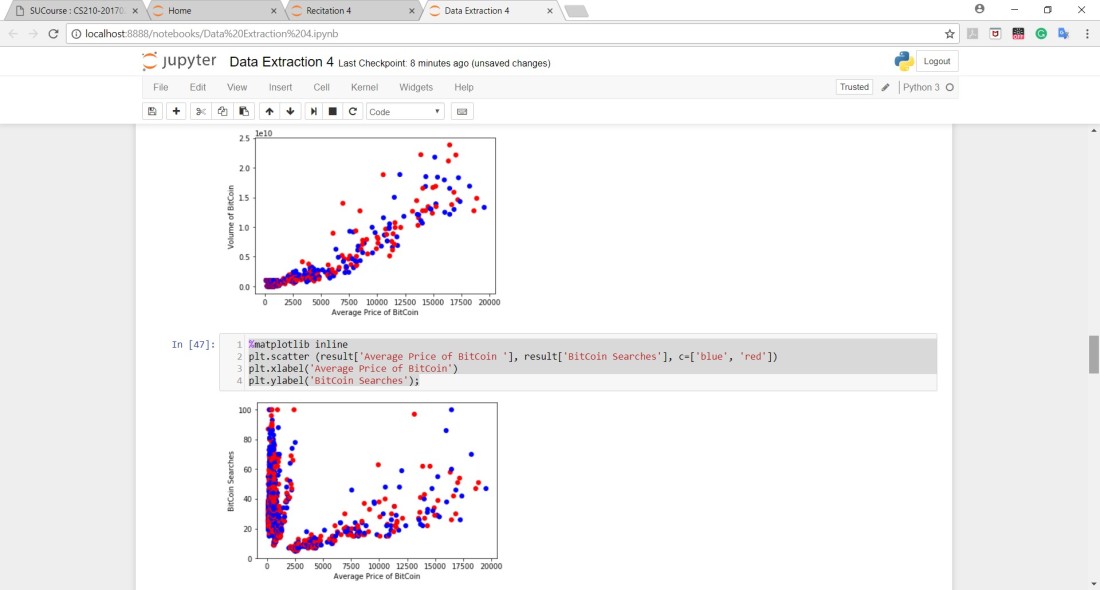
The first two graphs show the correlation between the volume of Bitcoin and the Trend of the word BitCoin on google with my target. As you can see, there is a positive correlation with the volume but no correlation with Trend of the word BitCoin:
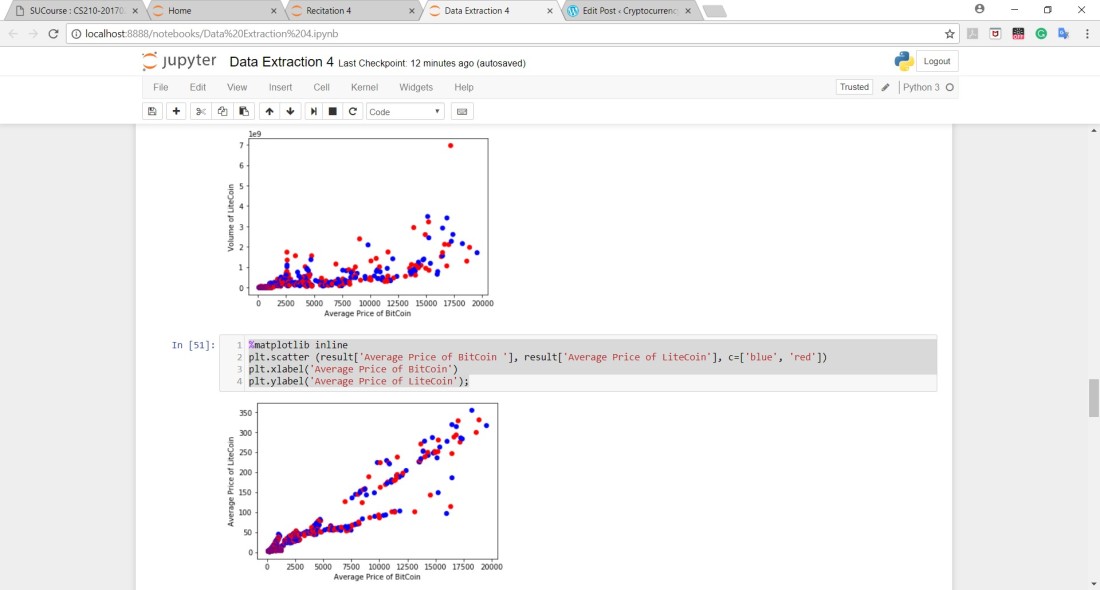
The second two graphs show the correlation between the volume of LiteCoin and the average price of LiteCoin with my target. As you can see, there is a weak positive correlation with the volume but there is a strong positive correlation with the Average Price of LiteCoin:
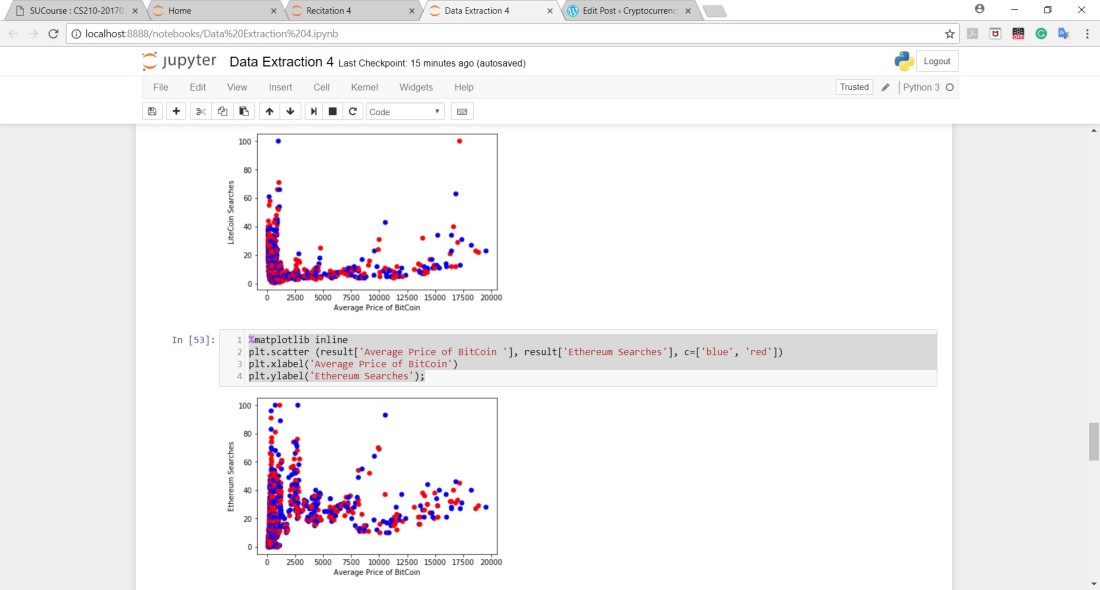
The next two graphs show the correlation between the LiteCoin Trend on google and the Ethereum Trend on google. As you can see, there is no correlation in both graphs. They both show weird behavior:
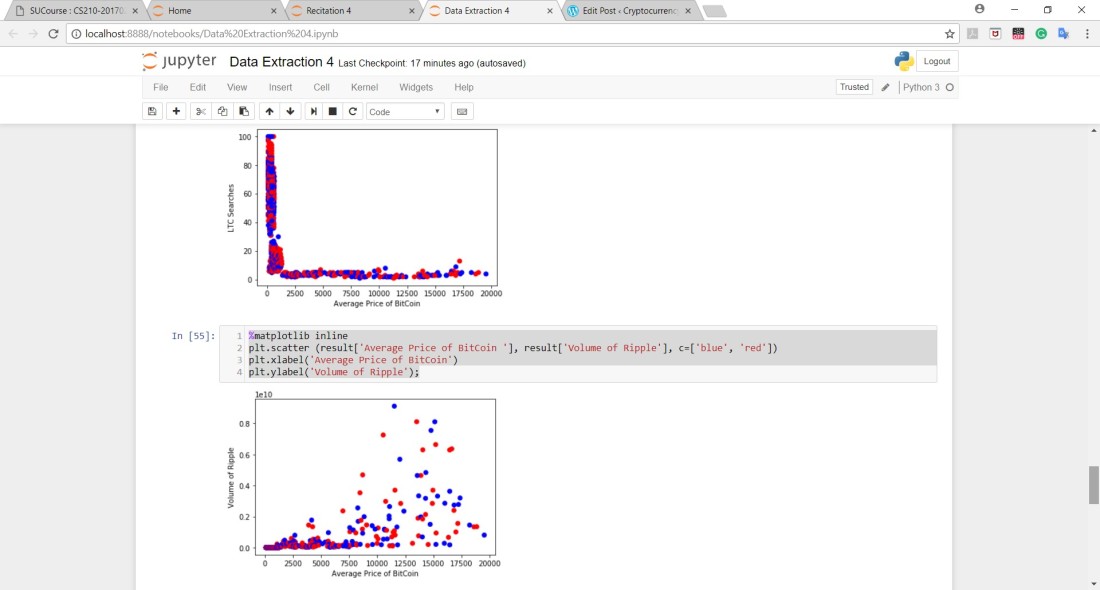
The next two graphs show the correlation between the LTC Trend on google and the volume of Ripple. As you can see, there is no correlation in both graphs. Again, they both show weird behavior:
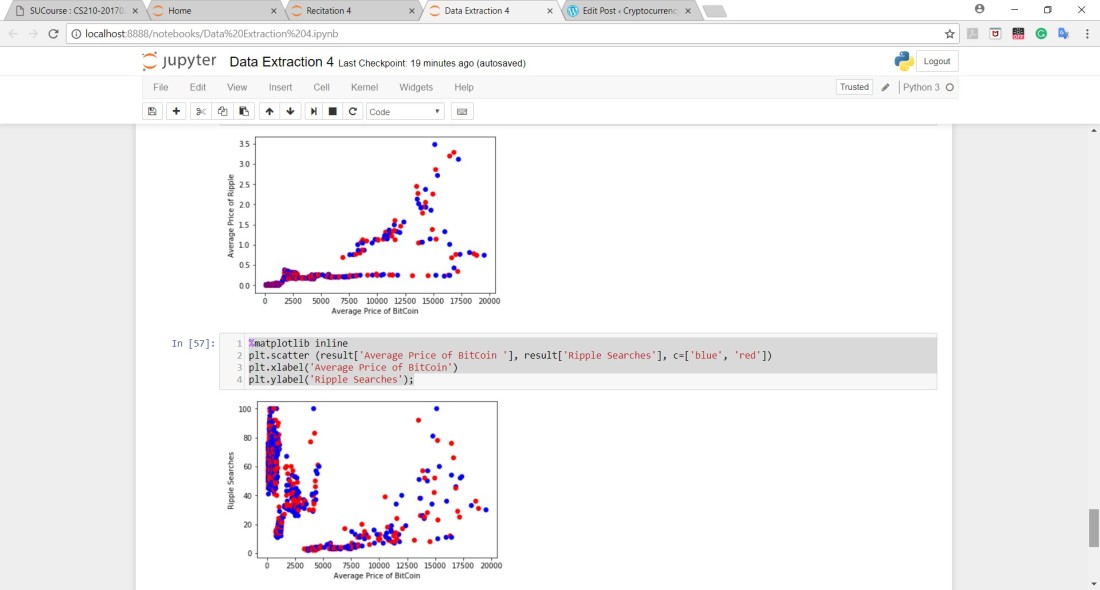
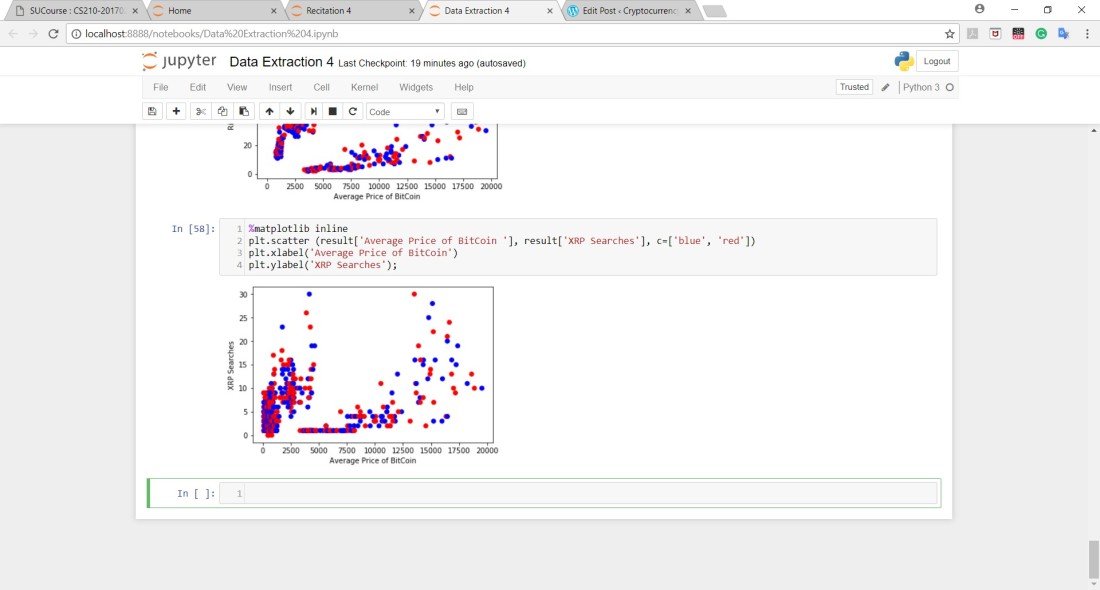
The last three graphs show the correlation between the Average Price of Ripple and the Trends of both Ripple and XRP on google. As you can see, there is no correlation in the last two graphs but the first graph shows a weak positive correlation with a weird behavior: